

Luminescence imaging
The basic principle of luminescence imaging is to excite the surface of a sample to make it glow, and then capture the luminescent imaging with a camera.
Two imaging methods commonly used in crystalline silicon cells
PL, Photo-luminescence, is excited by incident photons. The light source illuminates the entire sample uniformly, so the resulting imaging is a true luminescence profile of the sample, unaffected by non-uniform excitation or local cross-resistance. The local luminescence intensity of imaging is determined by the carrier density and lifetime of the region. The stronger the glow in an area, the higher the pixel value. Conversely, the weaker the emitted area, the lower the pixel value. There are several factors that can make the glow diminished:
Low carrier lifetime
The doping density of the carriers is low
Local defects (formation of carrier recombination centers and reduction of local carrier lifetimes). Local defects include: elemental impurities, physical defects of silicon crystals (e.g., cracks, dislocations), grain boundaries of polysilicon, etc.
EL, electroluminescence, is excited by an electric current. During the generation of EL imaging, an excitation current is injected into the main grid of the cell. The series resistance of the solar cell itself causes the excitation voltage to gradually decrease, so that the excitation degree outside the busbar is gradually weakened. Therefore, the imaging will also reflect the phenomenon of uneven excitation on the basis of the real luminescence distribution map. In addition, the local series resistance distribution also changes the degree of reduction of the excitation voltage, which further weakens the luminescence.
PL vs EL analysis comparison
The EL image contains the effect of series resistance + the effect of local defects (compound loss)
PL images do not show the effect of series resistance, and are mainly affected by local defects (compound loss)
PL imaging was normal, and the EL imaging area was dark, indicating that resistance loss was the main loss factor
The PL imaging was dark and the EL imaging was also dark, indicating that the defect (compound loss) was the main cause
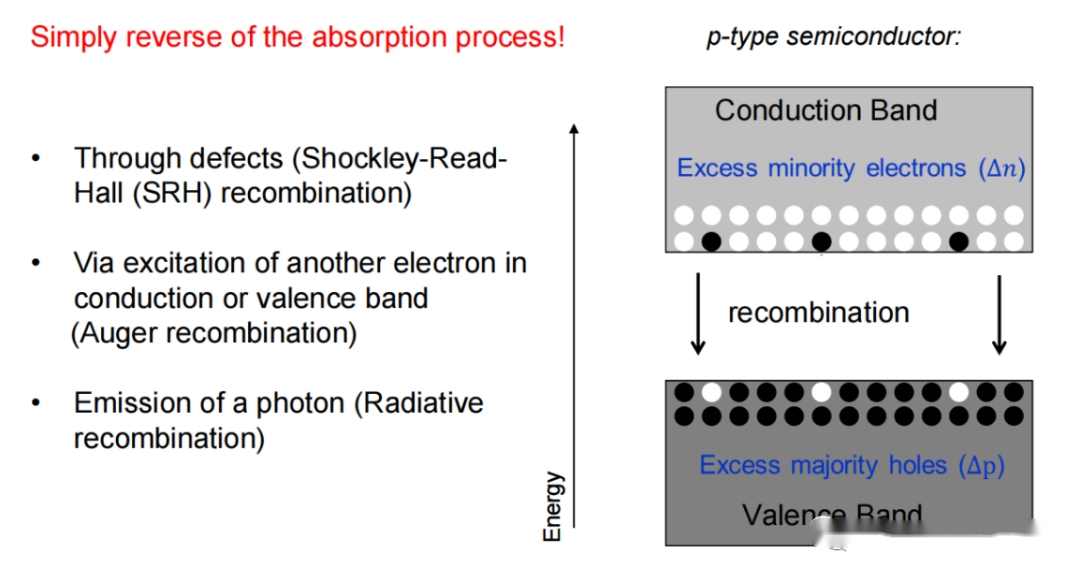
The luminous intensity is further analyzed
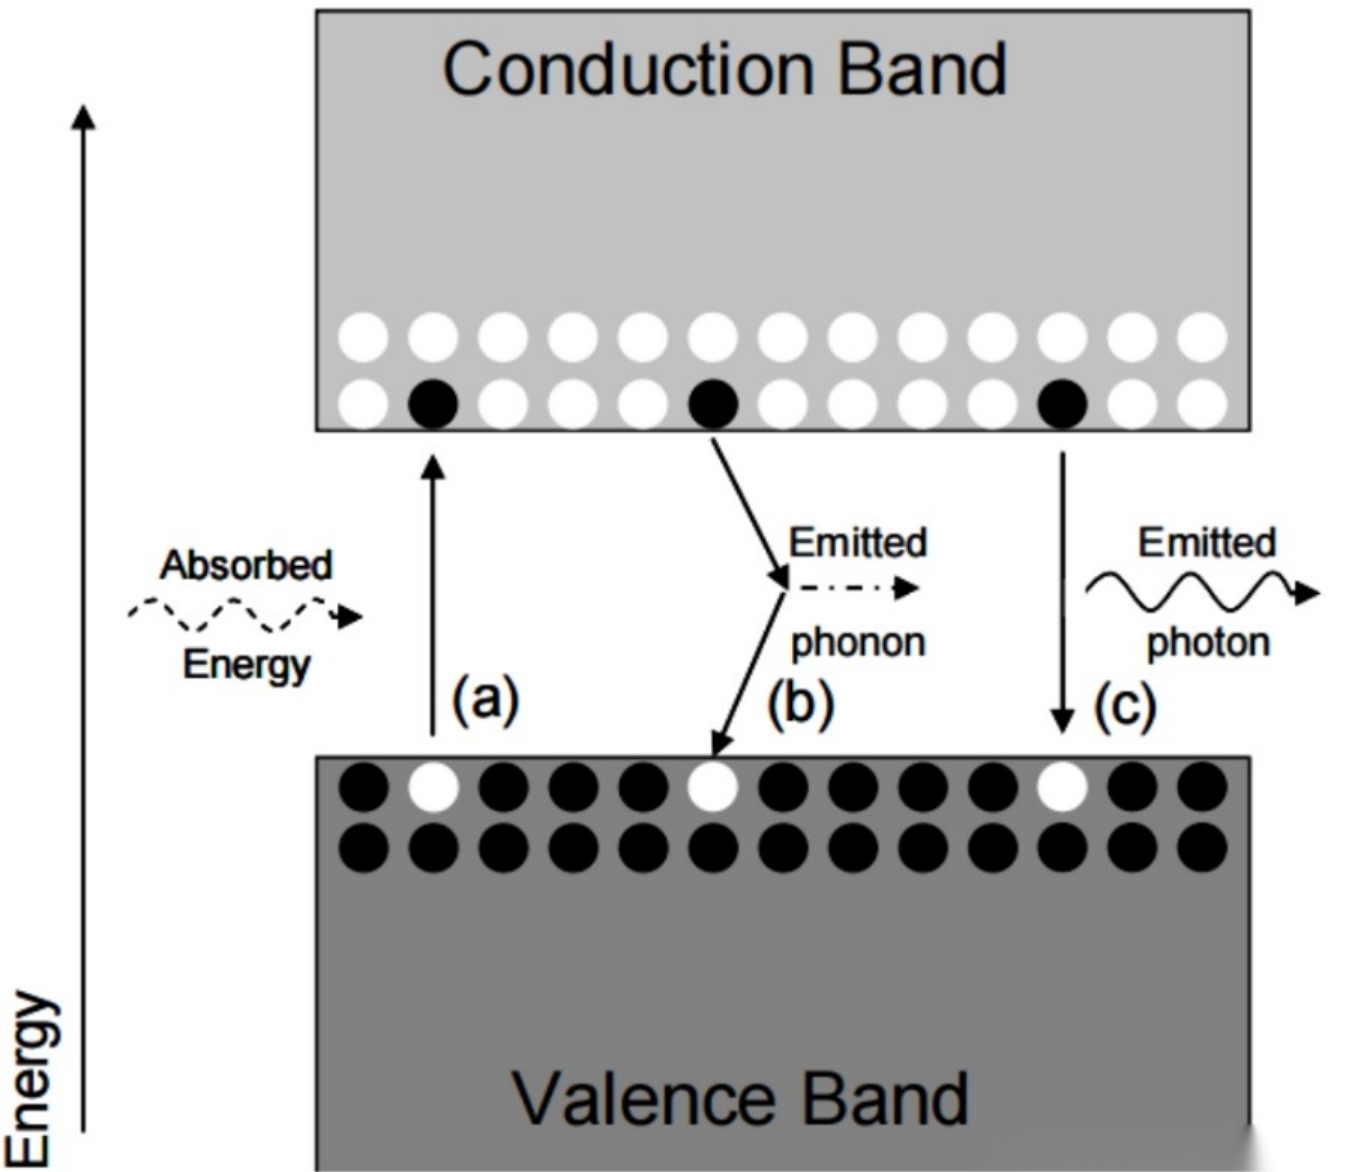
The production of surplus and low births → the compound of low births
SRH composite, poor luminous intensity
Auger recombination with poor luminous intensity
Radiant recombination with maximum luminous intensity (defect-free state)

 PL imaging interpretation

The PL intensity is positively correlated with the proportion of spontaneous radiation excitation
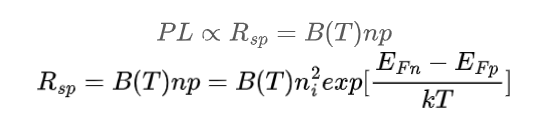
- Proportionality constant, injection level  is constant
PL can be tested in two modes: steady state (SS) and quasi steady state (QSS).
PL tests for low subon lifetime, which is not affected by the space charge region
It can output a map of the life of the few sons
It can be converted to iVoc
The higher the brightness→ more radiative recombination
A dim brightness → indicates less radiative recombination→ lower NP values→ fewer sons and lower lifetimes


 English
 español
 한국의
한국의


 IPv6 network supported