

Luminescent imaging
The basic principle of luminous imaging is to excite the surface of a sample to make it glow, and then capture the luminous image with a camera.
Two imaging methods are commonly used in crystalline silicon solar cells
PL, Photo-luminescence, photoluminescence, excitation by incident photons. The light source uniformly illuminates the entire sample, so the resulting image is a true luminescence profile of the sample, not affected by uneven excitation or local string resistance. The local luminous intensity of the image is determined by the carrier density and lifetime of the region. The stronger the light in an area, the higher the pixel value. Conversely, the less luminous the region, the lower its pixel value. There are several factors that can make the glow decrease:
EL, electroluminescence, excited by an electric current. In the process of generating an EL image, an excited current is injected into the busbar of the solar cell. The series resistance of the solar cell itself causes the excitation voltage to drop gradually, so that the excitation degree outside the busbar is gradually weakened. Therefore, the imaging also reflects the excitation heterogeneity on the basis of the real luminescence distribution. In addition, the local series resistance distribution also changes the degree of drop in excitation voltage, which further weakens the luminescence.
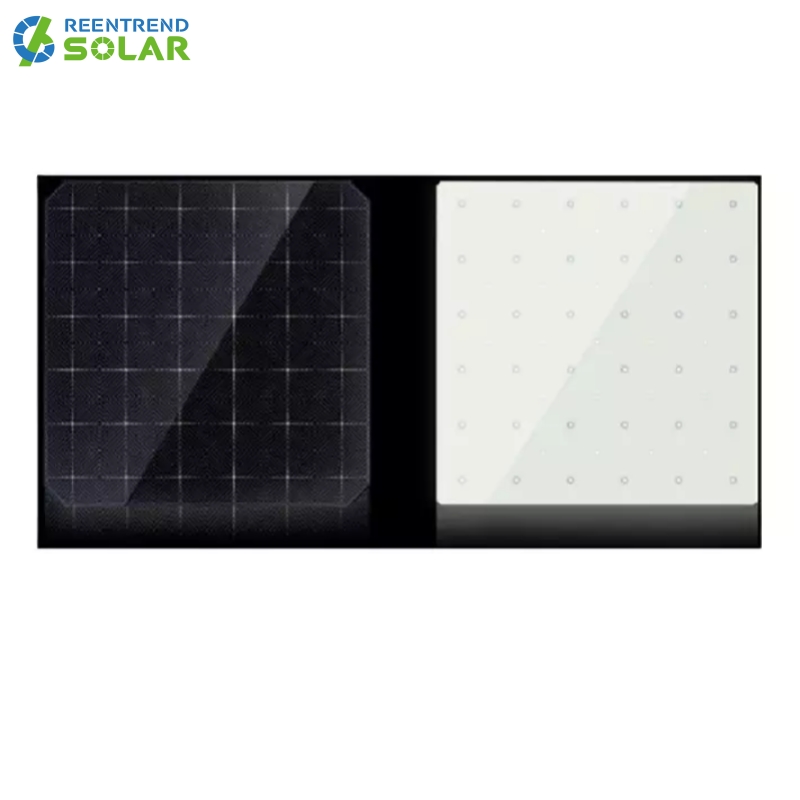
PL vs EL analysis and comparison
The luminescence intensity was further analyzed


PL imaging interpretation

The PL intensity is positively correlated with the proportion of spontaneous radiation excitation


 English
 español
 한국의
한국의


 IPv6 network supported